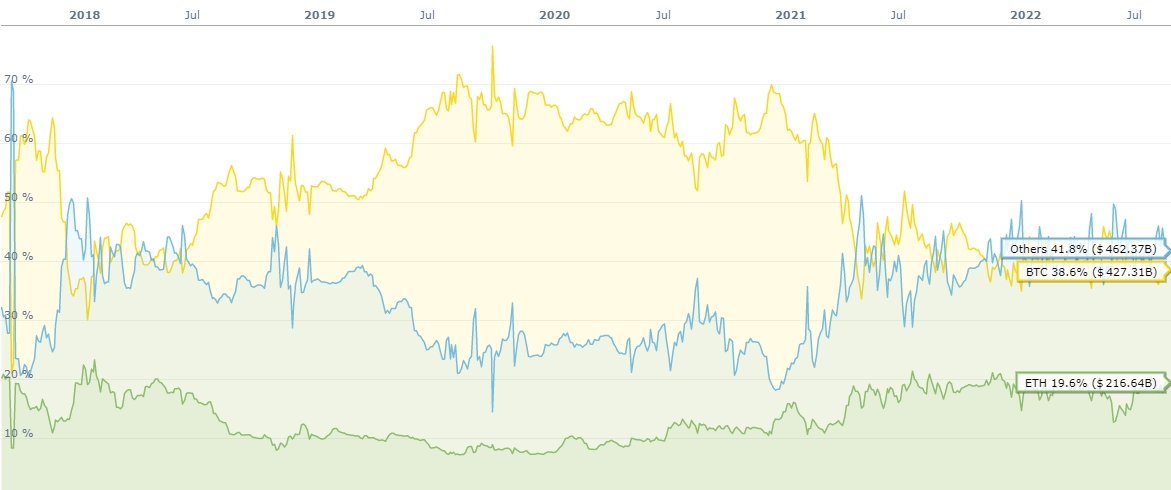
Bitcoin dominance (BTCD) is one of the most important indicators in the crypto market. Bitcoin largely controls the total value of the cryptocurrency market and determines price trends. In essence, BTC dominance is an indicator of how altcoins are performing compared to Bitcoin, which has several critical implications for understanding how to read crypto charts.
Total Market Capitalization
The total market cap reflects the total value of all cryptocurrencies that are in circulation. Every cryptocurrency has a price and a circulating supply. The market value of a cryptocurrency is obtained by multiplying these two numbers together. The total market cap can be a useful measure of how the cryptocurrency industry has performed over time.
What is Bitcoin Dominance?
BTC dominance indicates the ratio of Bitcoin's market capitalization to the rest of the market. This ratio, which is determined by dividing the total value of the cryptocurrency market by the market value of Bitcoin, can help us understand where the market will go. We can understand Bitcoin's market share, how much of the market's trading volume is in altcoins, whether we are in the altcoin season, and much more, with the help of the Bitcoin dominance indicator.
If Bitcoin Dominance Rises
Bitcoin was the first cryptocurrency and is considered a worldwide digital store of value. Therefore, the cryptocurrency that has the most impact on the cryptocurrency market is Bitcoin. The total value of the market usually follows Bitcoin's price movements. If BTC dominance is rising, it means that altcoins are losing value. An increase in this rate means that traders in the market prefer to hold Bitcoin instead of altcoins.
If Bitcoin Dominance Decreases
On the contrary, if Bitcoin dominance is falling, we can understand that altcoins are gaining value against Bitcoin. The fact that traders prefer to hold altcoins over Bitcoin indicates that the trading volume is in altcoins rather than Bitcoin. The increase in the altcoin market share ensures the formation of a more mature market, as it also represents an increase in the number of investors in the market.
These are the basics we need to know. But the BTCD index may be telling us much more. Bitcoin dominance can serve as a useful outlet for multiple trading strategies.
BTCD Trading Strategies
Some traders put BTCD in an important place in their trading strategy. Although cryptocurrencies are relatively new and volatile investment vehicles, these strategies have generally proved to be moderately successful.
- BTC dominance growing and Bitcoin price is rising (Bitcoin bull market): Buy Bitcoin
- BTC dominance shrinking and Bitcoin price rising (Altcoin bull market): Buy Altcoins
- BTC dominance shrinking and Bitcoin price stable (Altcoin bull market): Buy Altcoins
- BTC dominance shrinking and Bitcoin price falling (Bitcoin bear market): Sell Bitcoin
- BTC dominance growing and Bitcoin price falling (Altcoin bear market): Sell Altcoins
Although we can make such a table, BTCD cannot be used in a vacuum. Before making any trading decision, we should thoroughly research all the conditions of the market and consider the broader macroeconomic factors as well.

Share of Bitcoin, Ethereum, and other digital assets (grouped as "Others") as a percentage of the total crypto market cap.
Bitcoin Dominance by Years
Bitcoin dominance has been at different rates over the years. Scenarios with low dominance often represent bull markets. Although Bitcoin price increases during these optimistic periods, the prices of altcoins increase more, so we can observe a rising total market cap chart and a falling BTCD chart.
| Year | Bitcoin Dominance | Ethereum Dominance | Others |
| 2013 | 100% | - | |
| 2014 | 88.01% | - | 11.99% |
| 2015 | 78.34% | - | 21.66% |
| 2016 | 91.54% | 1.00% | 7.46% |
| 2017 | 87.15% | 3.83% | 9.02% |
| 2018 | 37.38% | 11.87% | 49.25% |
| 2019 | 51.33% | 11.01% | 37.67% |
| 2020 | 68.27% | 7.38% | 24.35% |
| 2021 | 68.10% | 10.74% | 21.16% |
| 2022 | 37.83% | 18.95% | 43.22% |
| September 2022 | 37.39% | 19.01% | 43.62% |
It is not known whether Bitcoin will one day be overshadowed by Ethereum or any other altcoin. On June 13, 2017, Bitcoin dominance was 39.19%, while Ethereum dominance was 33.91%. While the price of BTC was $2755, with a market cap of $45.30B, the price of ETH reached $385 and market cap of $35.65B. 1 ETH was worth 0.1516 BTC that day, but that level was never approached again. Since May 2021, ETH/BTC has been fluctuating between 0.052 and 0.088.
You could very well see benefits when using the BTCD utility chart when making trades. However, it should not be forgotten that Bitcoin dominance alone does not tell the whole story and probably shouldn't be used as a primary reference point when trading. In addition, while historically speaking, BTCD was a good predictor of altcoin and Bitcoin seasons, its future utility cannot be guaranteed.


